
Massachusetts Department of Transportation (DOT)’s IMPACT data tool suite is a web-based application that provides data, maps and charts for crashes within the Commonwealth. By providing users with the ability to query and visualize Massachusetts crash data, IMPACT grants roadway safety stakeholders an enhanced opportunity to implement and reinforce safety initiatives and programming.
Currently, IMPACT consists of six modules: Interactive Data Dashboards, Data Query and Visualization, Data Extraction, Reports, Crash Tabulation and Charting, and Safety Analysis Tools.
Interactive Data Dashboards
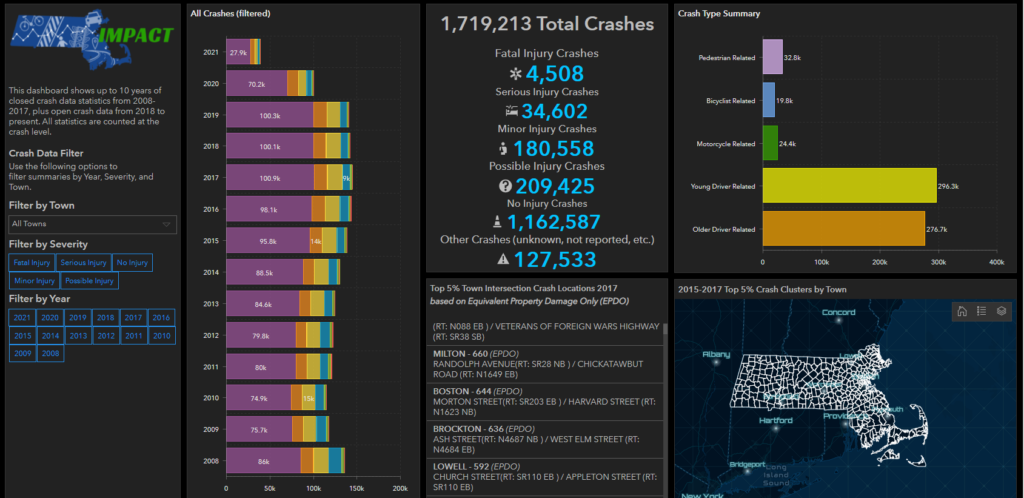
This module enables users to quickly engage in interactive analysis and data exploration using pre-built dashboards, consisting of Fatal Information Year to Date, State Highway Safety Plan (SHSP) Emphasis Areas, Statewide Crashes by Severity and Year, Fatal Information by Year, and Geocoding Performance Metrics.
Data Query and Visualization
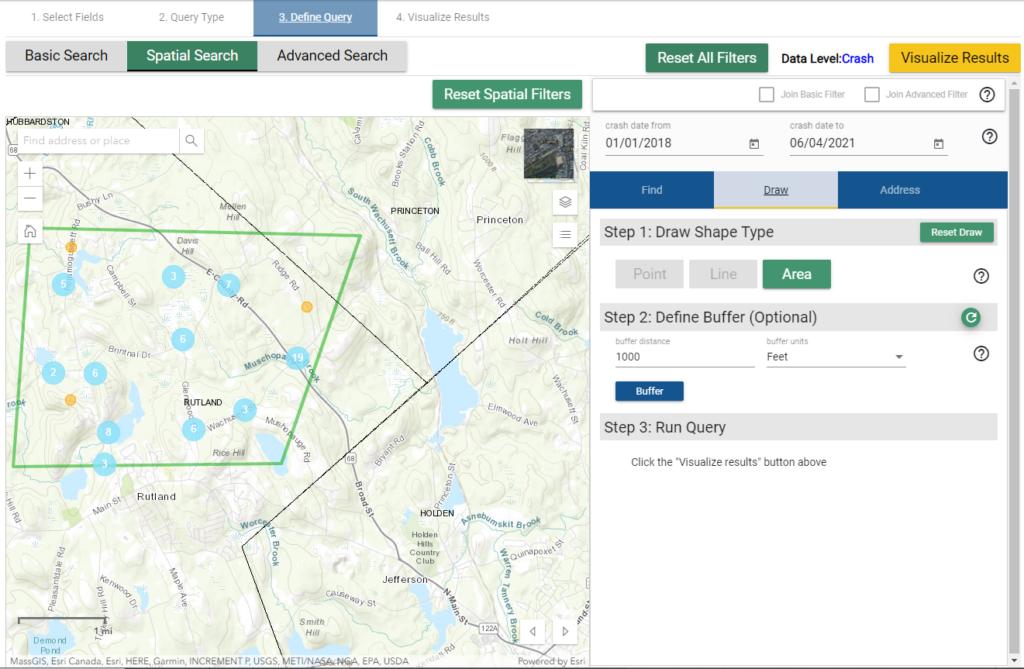
Users can conduct a wide range of data queries with this module, which can be visualized as charts, as tables, or spatially on a map. Furthermore, data can be queried by Basic Search, Advanced Search, as well as the Spatial Search which allows users to draw a point, line or polygon on a map of Massachusetts to capture the crash, person, and vehicle data for the area that’s been drawn. Additionally, Spatial Search allows users to query data by entering a specific street address.
Data Extraction
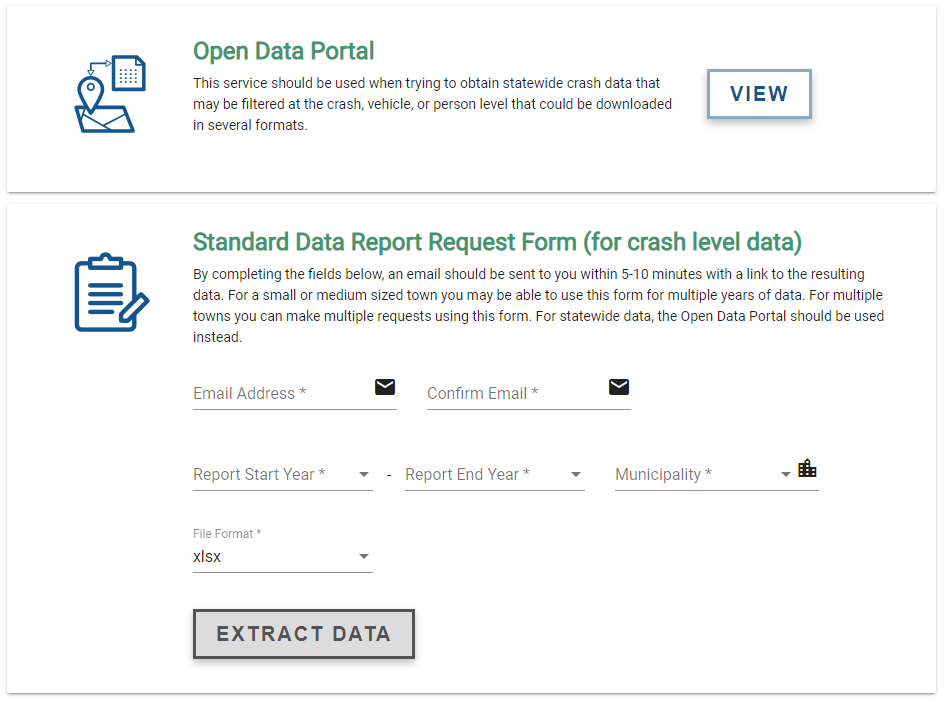
With this module, users can acquire statewide crash, vehicle, and person-level data – as well as request publicly available crash data by municipality and date range – that can be downloaded in various formats. Like with the other modules, the data can be filtered prior to downloading.
Reports
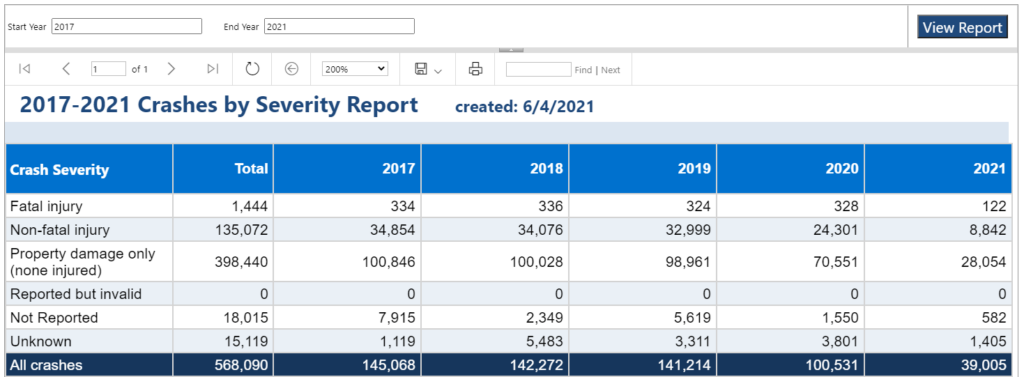
A large suite of standardized reports are available for quick access to organized information within a range of very specific and narrow categories, such as Crashes by Severity and Drive Distractions in Crashes. The “Grant Application – Crashes at a Glance” Report can be particularly useful when writing grant applications, as it enables users to prepare a report based on data from a specific town and timeframe.
Crash Tabulation and Charting
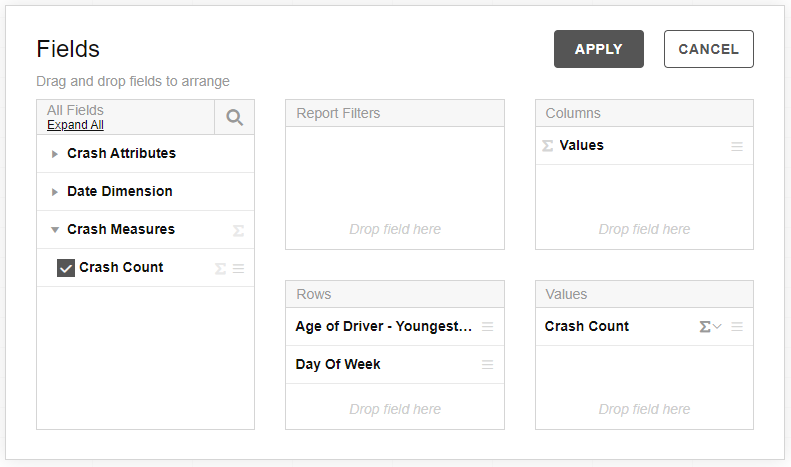
A spreadsheet tool, essentially functioning as a pivot table, that enables users to select fields to perform cross-reference analyses of two or more variables. This tool is useful for those who primarily want to look at the interrelationships between various factors in crashes. Data can be cross tabulated at the crash, vehicle, and person level.
Safety Analysis Tools
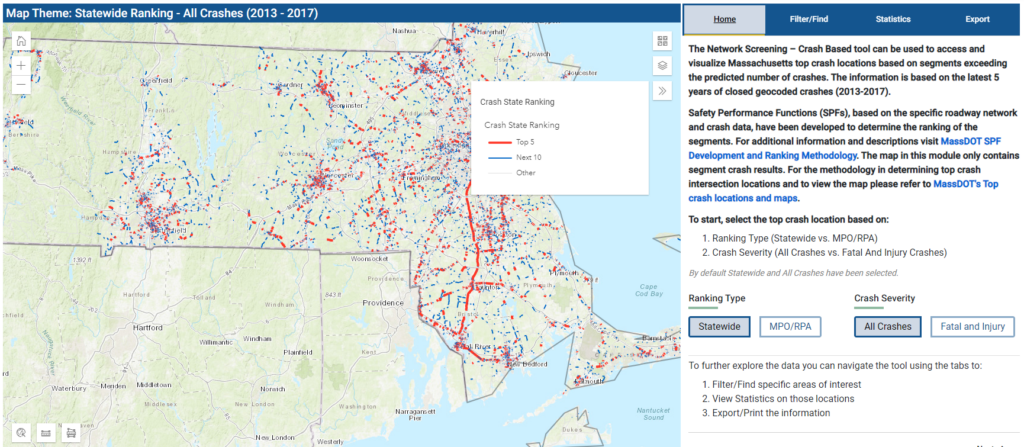
The most recent addition to IMPACT, currently consisting of two tools (with more to come)—Network Screening Crash Based and Network Screening Risk Based. These tools enable users to identify the top 5% and next 10% of the roadway segments with higher than predicted crashes and to identify the primary and secondary road segments with the highest risks based on the emphasis areas of the Strategic Highway Safety Plan. Coming soon is the Crash Tree tool which allows users to generate crash trees to summarize and analyze crash data. Also coming soon is the Test of Proportions tool which provides an automated process to identify overrepresented crash types and other data attributes within a user-defined area. Both the Crash Tree and the Test of Proportions can be done at the crash level, vehicle level or person level and will be available in late summer..
Informing Our Work
Ultimately, the IMPACT suite provides a rich and nuanced array of tools for project planning and implementation for all traffic safety stakeholders. It’s currently used to help determine Highway Safety Improvement Plan eligibility, to conduct Road Safety Audits, to inform and enact programming related to the Strategic Highway Safety Plan, and much more. Visit IMPACT here to learn how it can help enhance your traffic safety project or initiative.